


How Odoo BI features power Odoo business intelligence dashboard
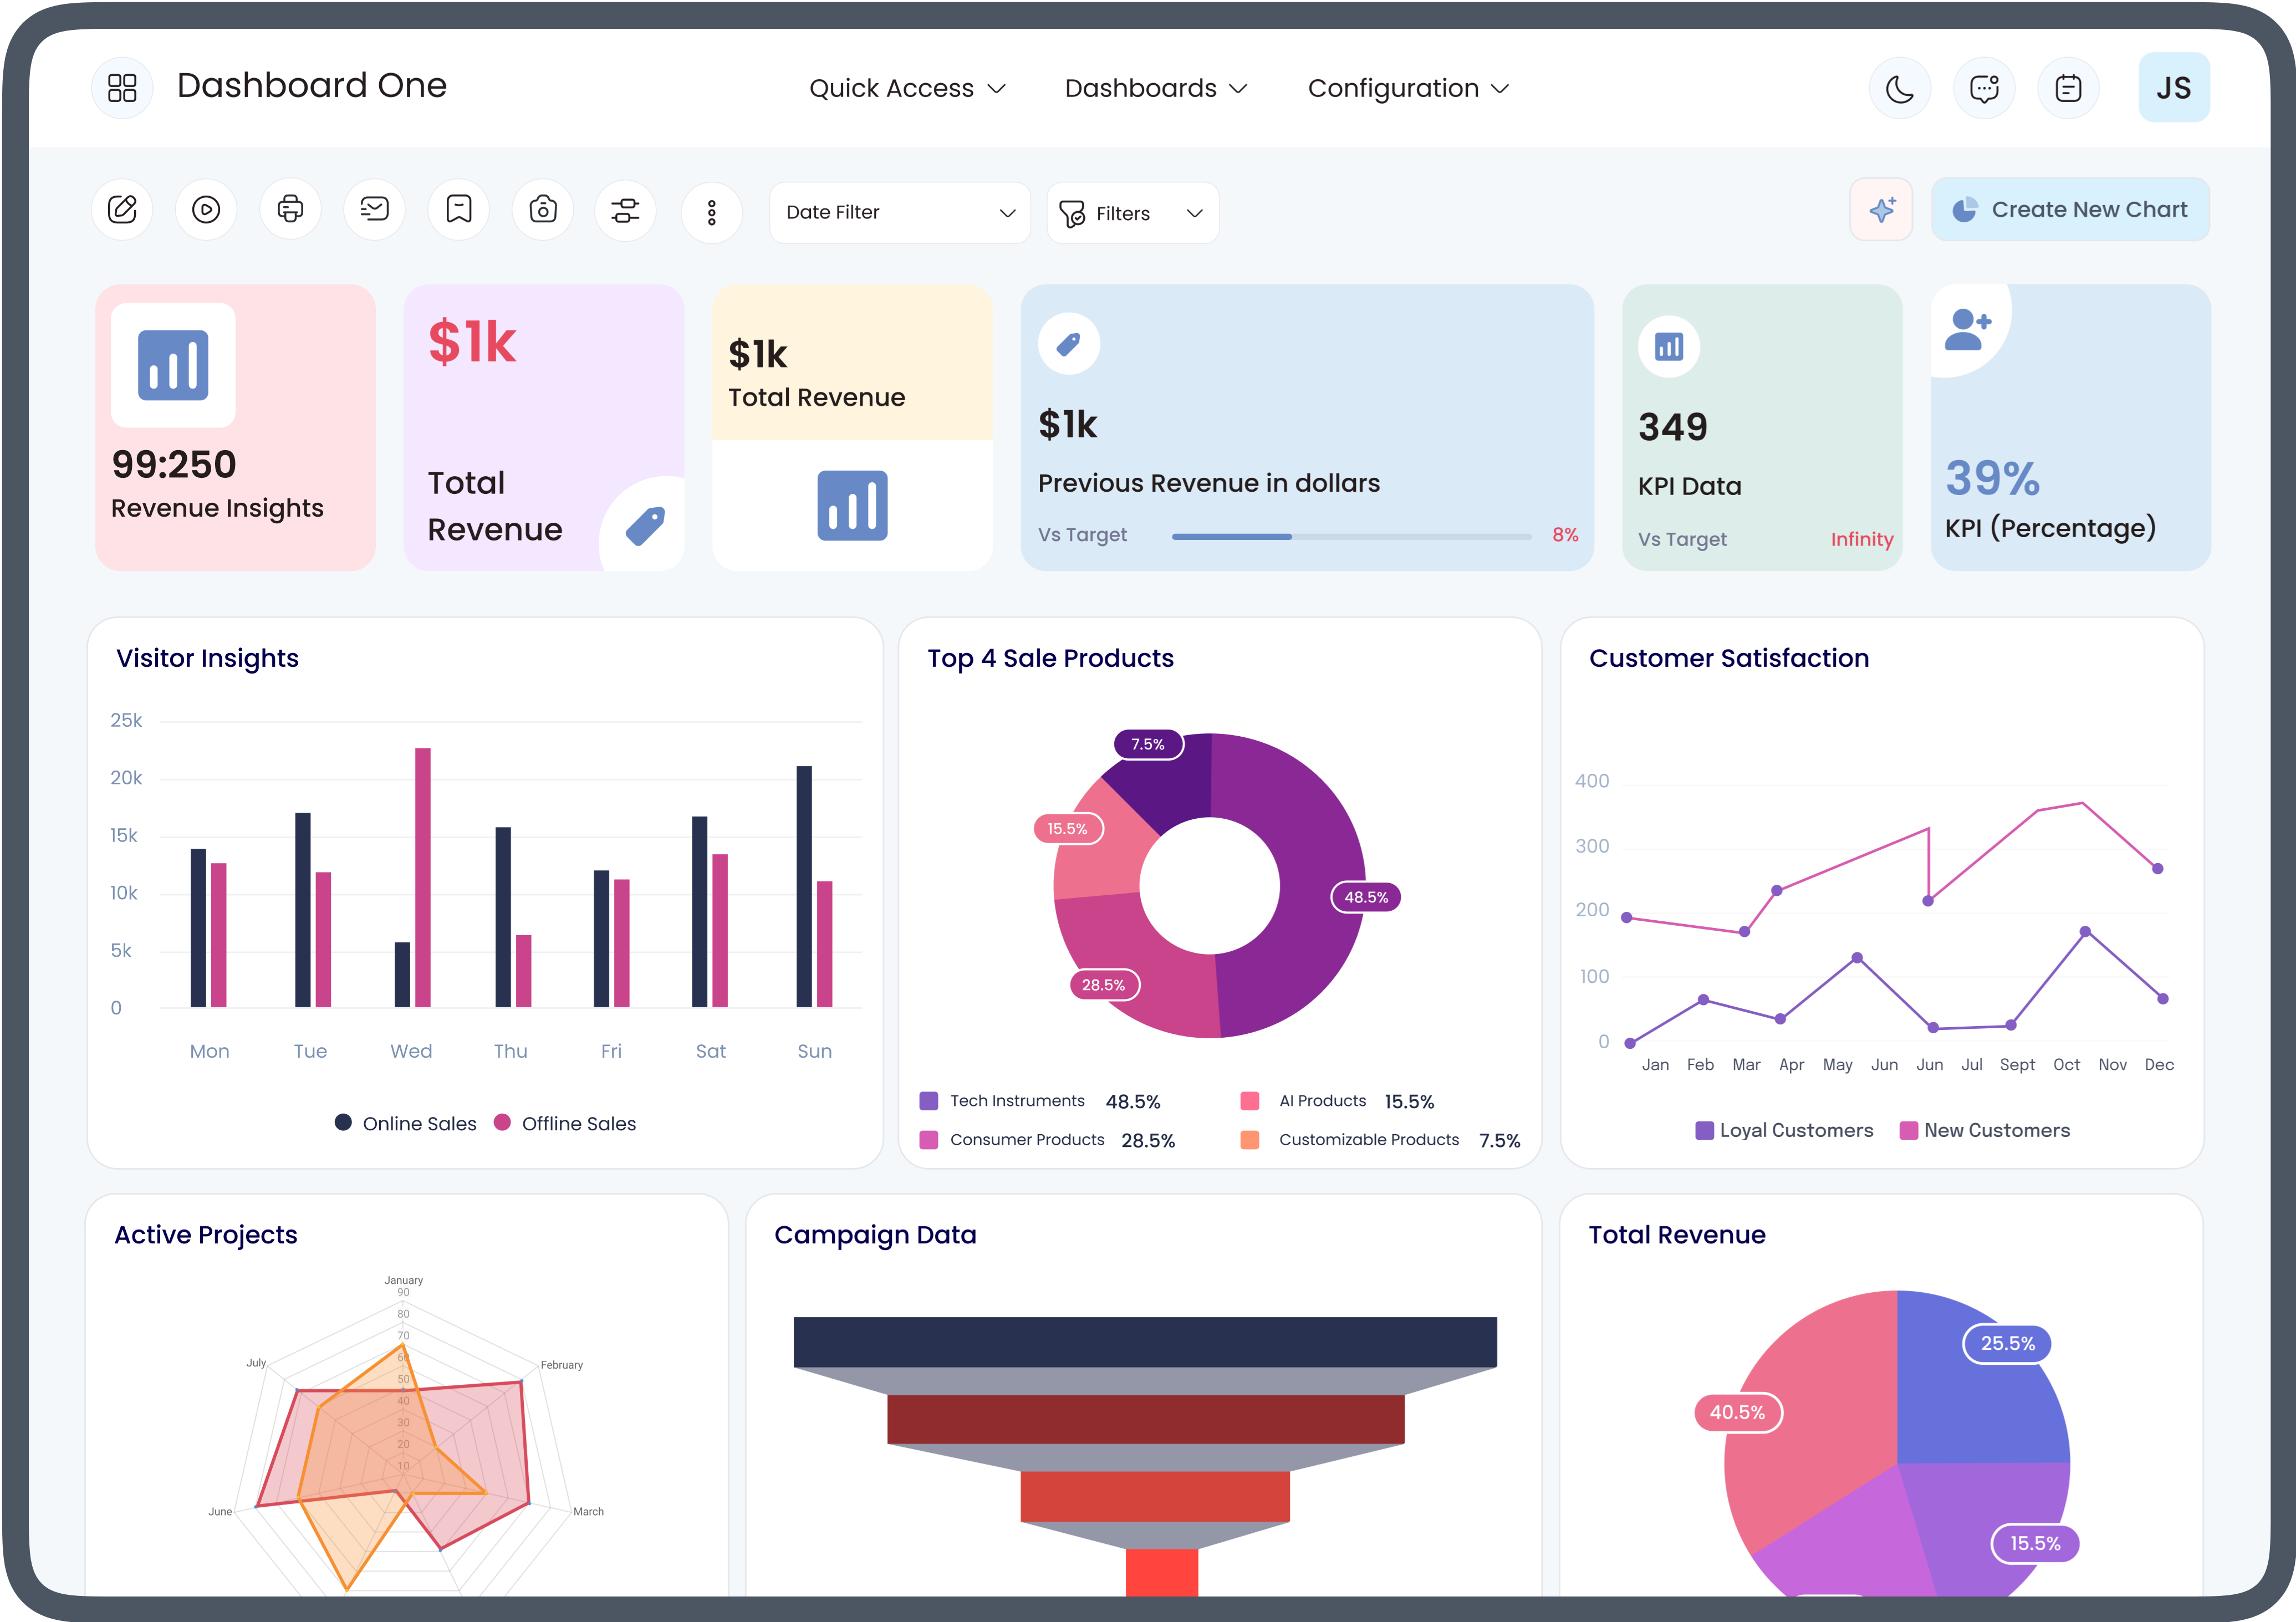
Businesses generate large amounts of data every day through sales, inventory, accounting, purchasing, manufacturing, and customer interactions. While collecting data is important, turning it into meaningful insights is what helps organizations make smarter decisions. This is where Odoo BI features play a valuable role. They transform raw business data into visual reports and actionable insights through an Odoo business intelligence dashboard.
Organizations that rely on Odoo can monitor key performance indicators, analyze trends, identify opportunities, and improve operational efficiency without manually compiling reports from different modules. By using built-in analytics and advanced business intelligence capabilities, managers gain a complete view of business performance in one place.
Understanding Odoo BI Features
Odoo BI features refer to the collection of analytical tools, reporting capabilities, visualization options, and performance tracking functions available within the Odoo ecosystem. These features help businesses gather information from multiple modules and present it in an easy-to-understand format.
Instead of reviewing spreadsheets or exporting data repeatedly, users can access interactive reports that update automatically. This enables management teams to respond quickly to changing business conditions while improving decision-making across departments.
Some common BI capabilities include:
-
Interactive charts
-
Real-time reporting
-
KPI tracking
-
Custom dashboards
-
Multi-module analytics
-
Drill-down reporting
-
Automated data refresh
-
Advanced filtering options
These capabilities make business information easier to understand for both executives and operational teams.
What Is an Odoo Business Intelligence Dashboard?
An Odoo business intelligence dashboard is a centralized interface that displays important business metrics collected from different Odoo modules. Rather than opening multiple applications, users can monitor sales, inventory, finance, CRM, manufacturing, HR, and purchasing information from a single dashboard.
Dashboards present complex information visually using:
-
Line charts
-
Pie charts
-
Bar graphs
-
Pivot tables
-
KPI cards
-
Heat maps
-
Performance indicators
-
Interactive reports
This visual approach allows decision-makers to recognize patterns much faster than reviewing raw numerical data.
Why Businesses Need Business Intelligence in Odoo
Growing businesses often struggle with scattered information. Sales data may exist in one module while accounting, purchasing, and inventory reside elsewhere. Without centralized reporting, decision-making becomes slower.
Business intelligence solves this challenge by combining information from multiple business functions into one reporting environment.
Benefits include:
-
Faster reporting
-
Better forecasting
-
Improved resource planning
-
Increased operational visibility
-
Higher productivity
-
Better customer analysis
-
Improved financial monitoring
These advantages help organizations respond more effectively to both opportunities and challenges.
Key Odoo BI Features That Improve Reporting
Real-Time Data Visualization
One of the most valuable Odoo BI features is real-time visualization. Reports update automatically as new transactions occur within Odoo.
Managers no longer need to wait until the end of the day or week to review performance. Instead, they can monitor sales, revenue, inventory levels, and customer activities throughout the business day.
Real-time dashboards reduce reporting delays and improve operational awareness.
Interactive Dashboard Widgets
Modern dashboards provide interactive widgets that display different business metrics.
Examples include:
-
Monthly sales
-
Outstanding invoices
-
Purchase orders
-
Stock availability
-
Manufacturing progress
-
Employee attendance
-
CRM pipeline status
Users can rearrange widgets according to their priorities, making the dashboard more personalized and efficient.
Custom KPI Monitoring
Every business measures success differently. An Odoo business intelligence dashboard allows organizations to track KPIs that match their goals.
Examples include:
-
Revenue growth
-
Gross profit
-
Sales conversion rate
-
Customer acquisition
-
Inventory turnover
-
Collection performance
-
Purchase costs
-
Production efficiency
Custom KPIs ensure management focuses on the most relevant performance indicators.
Drill-Down Reporting
High-level summaries often raise additional questions. Drill-down reporting allows users to click on charts or metrics and explore the underlying data.
For example, if sales decline, managers can drill into:
-
Individual products
-
Salespersons
-
Regions
-
Customer segments
-
Time periods
This detailed analysis helps identify the root cause behind performance changes.
Multi-Department Analytics
One major advantage of Odoo BI features is the ability to combine information from multiple departments.
Sales Analytics
Sales teams can monitor:
-
Revenue
-
Quotations
-
Confirmed orders
-
Product performance
-
Salesperson productivity
-
Customer trends
These insights support better sales planning.
Financial Analytics
Finance teams benefit from dashboards showing:
-
Cash flow
-
Accounts receivable
-
Accounts payable
-
Profit margins
-
Expenses
-
Tax summaries
This provides a clear financial overview without manually generating multiple reports.
Inventory Analytics
Warehouse managers can analyze:
-
Stock availability
-
Slow-moving inventory
-
Fast-selling products
-
Reorder levels
-
Warehouse performance
Better inventory visibility helps reduce shortages and excess stock.
CRM Analytics
Customer relationship management dashboards help businesses track:
-
Lead generation
-
Opportunity stages
-
Win rates
-
Sales funnel performance
-
Customer retention
These insights improve sales forecasting and customer engagement.
Custom Dashboard Design
Every organization has unique reporting needs. An Odoo business intelligence dashboard allows businesses to customize layouts according to their workflows.
Users can:
-
Add new charts
-
Remove unnecessary reports
-
Change widget positions
-
Apply custom filters
-
Create department-specific dashboards
Customization ensures employees see only the information relevant to their responsibilities.
Automated Reporting
Manual reporting consumes valuable time.
Many Odoo BI features automate report generation by:
-
Scheduling reports
-
Updating dashboards automatically
-
Refreshing KPIs
-
Sending reports through email
-
Exporting reports in multiple formats
Automation reduces repetitive work while improving reporting consistency.
Better Decision-Making Through Visual Analytics
Visual reports simplify complex business information.
Instead of reviewing hundreds of spreadsheet rows, executives can immediately recognize:
-
Revenue trends
-
Seasonal demand
-
Declining products
-
Regional performance
-
Customer behavior
-
Operational bottlenecks
Visual analytics enables faster business decisions with greater confidence.
Performance Monitoring Across the Organization
Business performance depends on multiple departments working together.
An Odoo business intelligence dashboard provides visibility into organization-wide performance by monitoring:
-
Sales growth
-
Customer satisfaction
-
Inventory health
-
Production efficiency
-
Financial stability
-
Employee productivity
This comprehensive overview encourages better collaboration across teams.
Improving Forecasting with Odoo BI Features
Forecasting becomes more accurate when businesses analyze historical data.
Organizations can identify:
-
Sales patterns
-
Customer purchasing behavior
-
Seasonal demand
-
Inventory consumption
-
Revenue trends
-
Expense fluctuations
These insights help management prepare for future business needs with greater confidence.
Data Security and Access Control
Business intelligence often contains sensitive financial and operational information.
Odoo allows administrators to control dashboard access based on user roles.
Permissions can be assigned so employees only view information relevant to their departments, helping protect confidential business data while maintaining reporting flexibility.
Choosing the Right Odoo Business Intelligence Dashboard
When selecting an Odoo business intelligence dashboard, businesses should evaluate whether it offers:
-
Interactive visualizations
-
Real-time reporting
-
Cross-module integration
-
KPI customization
-
Mobile accessibility
-
User-friendly interface
-
Automated reporting
-
Strong security controls
-
Scalable architecture
-
Flexible dashboard customization
Selecting the right solution ensures long-term reporting efficiency as the business grows.
Best Practices for Using Odoo BI Features
Businesses achieve better analytical results by following several best practices:
-
Define measurable KPIs.
-
Keep dashboards simple and relevant.
-
Review reports regularly.
-
Eliminate duplicate metrics.
-
Maintain accurate business data.
-
Train employees on dashboard usage.
-
Monitor performance trends consistently.
-
Update dashboards as business goals evolve.
These practices improve reporting quality and support informed decision-making.
Conclusion
Modern organizations rely on timely, accurate data to remain competitive. Odoo BI features simplify business analysis by transforming information from multiple Odoo modules into meaningful visual reports. An Odoo business intelligence dashboard centralizes this information, allowing businesses to monitor KPIs, analyze performance, automate reporting, and make faster, data-driven decisions.
Whether tracking sales, financial performance, inventory, CRM, or operations, a well-designed dashboard helps organizations improve efficiency while providing leadership with the insights needed for sustainable business growth.

 English
 Arabic
 French
 Spanish
 Portuguese
 Deutsch
 Turkish
 Dutch
Dutch
 Italiano
 Romaian
 Portuguese (Brazil)
 Greek
Greek