


How can I structure an NMR and IR spectroscopy analysis section in a formal chemistry lab report?
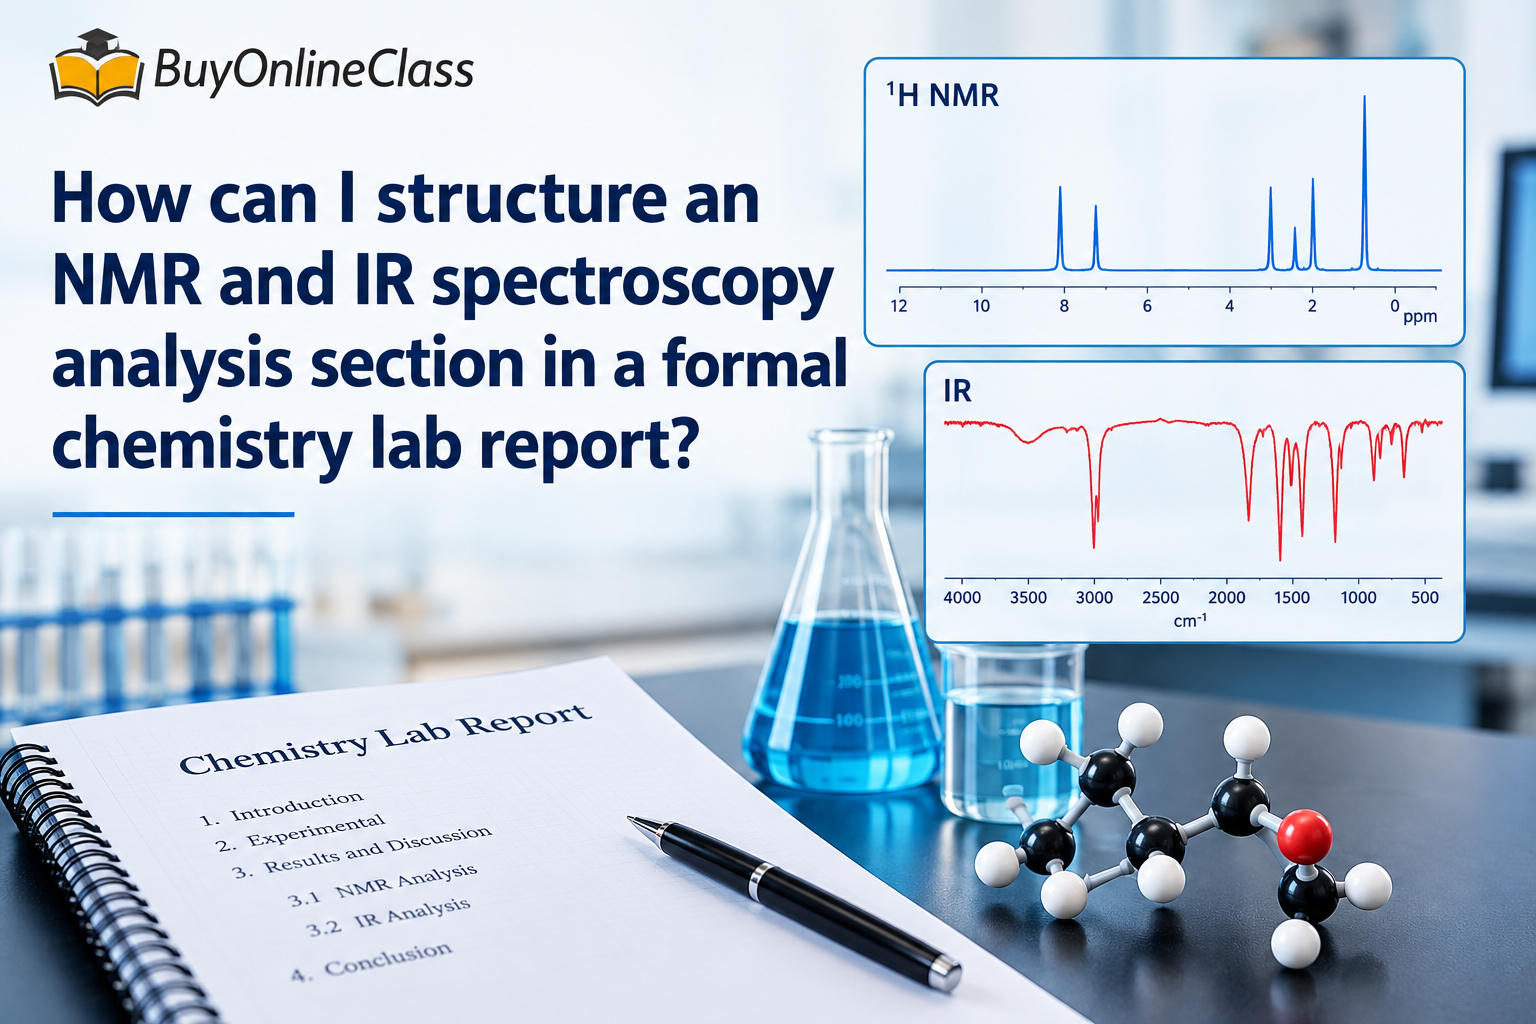
Spectroscopy analysis is frequently one of the most heavily weighted sections of an undergraduate chemistry lab report. For many US university students, synthesizing raw data from Nuclear Magnetic Resonance (NMR) and Infrared (IR) spectroscopy into a coherent, publication-style format presents a major hurdle.
A well-structured spectroscopy section does not simply list spectral peaks; it demonstrates how chemical structure directly correlates with observed experimental data. To earn full credit on a formal chemistry lab report, your spectroscopy analysis must feature a clear, standard structure: brief introduction of the compound, systematic IR analysis, detailed NMR breakdown, and an explicit synthesis explaining how the two techniques confirm your product's identity.
1. Organizing the Infrared (IR) Spectroscopy Analysis
The objective of IR spectroscopy in an organic chemistry lab report is to identify or confirm functional groups. Avoid listing every minor peak in your spectrum; focus strictly on diagnostic signals above $1500\text{ cm}^{-1}$.
When structuring your IR section, present the findings in both a formatted table and a accompanying paragraph that interprets key absorption bands.
Standard IR Data Table Format
Organize your IR peaks sequentially by wavenumber. A standard four-column layout provides clarity for readers and grading teaching assistants (TAs):
| Observed Frequency (cm−1) | Literature Frequency (cm−1) | Functional Group / Vibration Type | Intensity & Peak Shape |
| 3350 | 3300–3500 | O–H stretch | Broad, strong |
| 2960 | 2850–3000 | $\text{Csp}^3$–H stretch | Sharp, medium |
| 1715 | 1700–1725 | C=O stretch (Ketone) | Sharp, strong |
Narrative Interpretation
Following the table, write a short paragraph summarizing what the data confirms—and what it rules out. For example:
"The broad absorption band at $3350\text{ cm}^{-1}$ indicates the presence of a hydroxyl (O–H) group, while the intense peak at $1715\text{ cm}^{-1}$ confirms the carbonyl stretch of the ketone moiety. The absence of a peak near $2720\text{ cm}^{-1}$ confirms that no aldehyde C–H stretch is present."
2. Structuring the Proton ($^1\text{H}$) and Carbon ($^{13}\text{C}$) NMR Section
Proton NMR ($^1\text{H}$ NMR) provides structural connectivity details, while $^{13}\text{C}$ NMR establishes the carbon backbone. In a formal lab report, NMR data must adhere strictly to American Chemical Society (ACS) style conventions.
ACS Style Format for $^1\text{H}$ NMR
Write your $^1\text{H}$ NMR data in inline ACS format within the body of your report:
Break down each signal into four core attributes:
-
Chemical Shift ($\delta$ in ppm): Indicates the electronic environment (shielded vs. deshielded).
-
Multiplicity: Denoted as singlet (s), doublet (d), triplet (t), quartet (q), or multiplet (m).
-
Integration: Represents the relative number of protons contributing to the signal.
-
Coupling Constant ($J$ in Hz): Required for split peaks to show neighbor-proton interactions.
Systematic Proton Assignment Table
To make your analysis scannable, pair your ACS string with an assignment table mapping signals directly to the labeled molecular structure:
| Chemical Shift (δ, ppm) | Multiplicity | Integration | Peak Assignment | Justification |
| 7.22 | Multiplet | 4H | Aromatic protons ($\text{H}_a, \text{H}_b$) | Deshielded by aromatic ring current |
| 2.34 | Singlet | 3H | Benzylic methyl ($\text{H}_c$) | Adjacent to benzene ring, no neighboring protons |
3. Integrating IR and NMR into a Cohesive Structure Argument
A common mistake in chemistry reports is treating IR and NMR as isolated assignments. Higher-level grading rubrics require an integrative synthesis section that joins both analytical tools together.
Use a dedicated subsection titled Structural Confirmation to walk the reader through your logical deduction:
-
Functional Group Identification (IR): State how the IR spectrum confirms key functional groups (e.g., carbonyl, hydroxyl, amine).
-
Backbone Verification ($^{13}\text{C}$ NMR): Confirm the total number of unique carbon environments matched against the expected target structure.
-
Proton Mapping ($^1\text{H}$ NMR): Show how spin-spin splitting patterns verify the exact connectivity of adjacent carbon atoms.
-
Impurity Analysis: Explicitly address leftover starting material, solvent peaks (e.g., residual $\text{CHCl}_3$ at $7.26\text{ ppm}$), or side-products visible in the baseline.
4. Managing Complex Lab Reports and Analytical Deadlines
Balancing rigorous spectroscopy assignments alongside heavy course loads, multi-hour lab blocks, and exams can quickly become overwhelming for university students. Mastering physical chemistry, organic mechanisms, and instrumentation analysis demands substantial time and precise attention to detail.
When academic schedules become congested, getting specialized academic guidance or seeking reliable online support can help keep your coursework on track. Utilizing academic resources—whether university tutoring centers or specialized services to Do My Chemistry Homework Online—allows students to clarify difficult concepts, verify spectroscopy calculations, and meet strict departmental deadlines without sacrificing overall academic performance.
Checklist for Your Final Spectroscopy Section
Before submitting your lab report, verify your spectroscopy analysis against these final standards:
-
[ ] ACS Formatting: Ensure chemical shifts, multiplicities, and coupling constants follow standard ACS typography rules.
-
[ ] Diagnostic IR Focus: Exclude the complex fingerprint region ($<1500\text{ cm}^{-1}$) unless identifying a specific reference compound.
-
[ ] Structure Labeling: Include a clear diagram of your compound with labeled atoms ($\text{H}_a, \text{H}_b$, $\text{C}_1, \text{C}_2$) corresponding directly to your assignment tables.
-
[ ] Impurity Accounting: Account for unexpected small peaks rather than ignoring them; identifying residual solvents or water demonstrates thorough analytical skill.

 English
 Arabic
 French
 Spanish
 Portuguese
 Deutsch
 Dutch
Dutch
 Italiano
 Russian
 Romaian
 Portuguese (Brazil)
 Greek
Greek