


Smart Traffic Survey for Infrastructure and Urban Planning in UAE
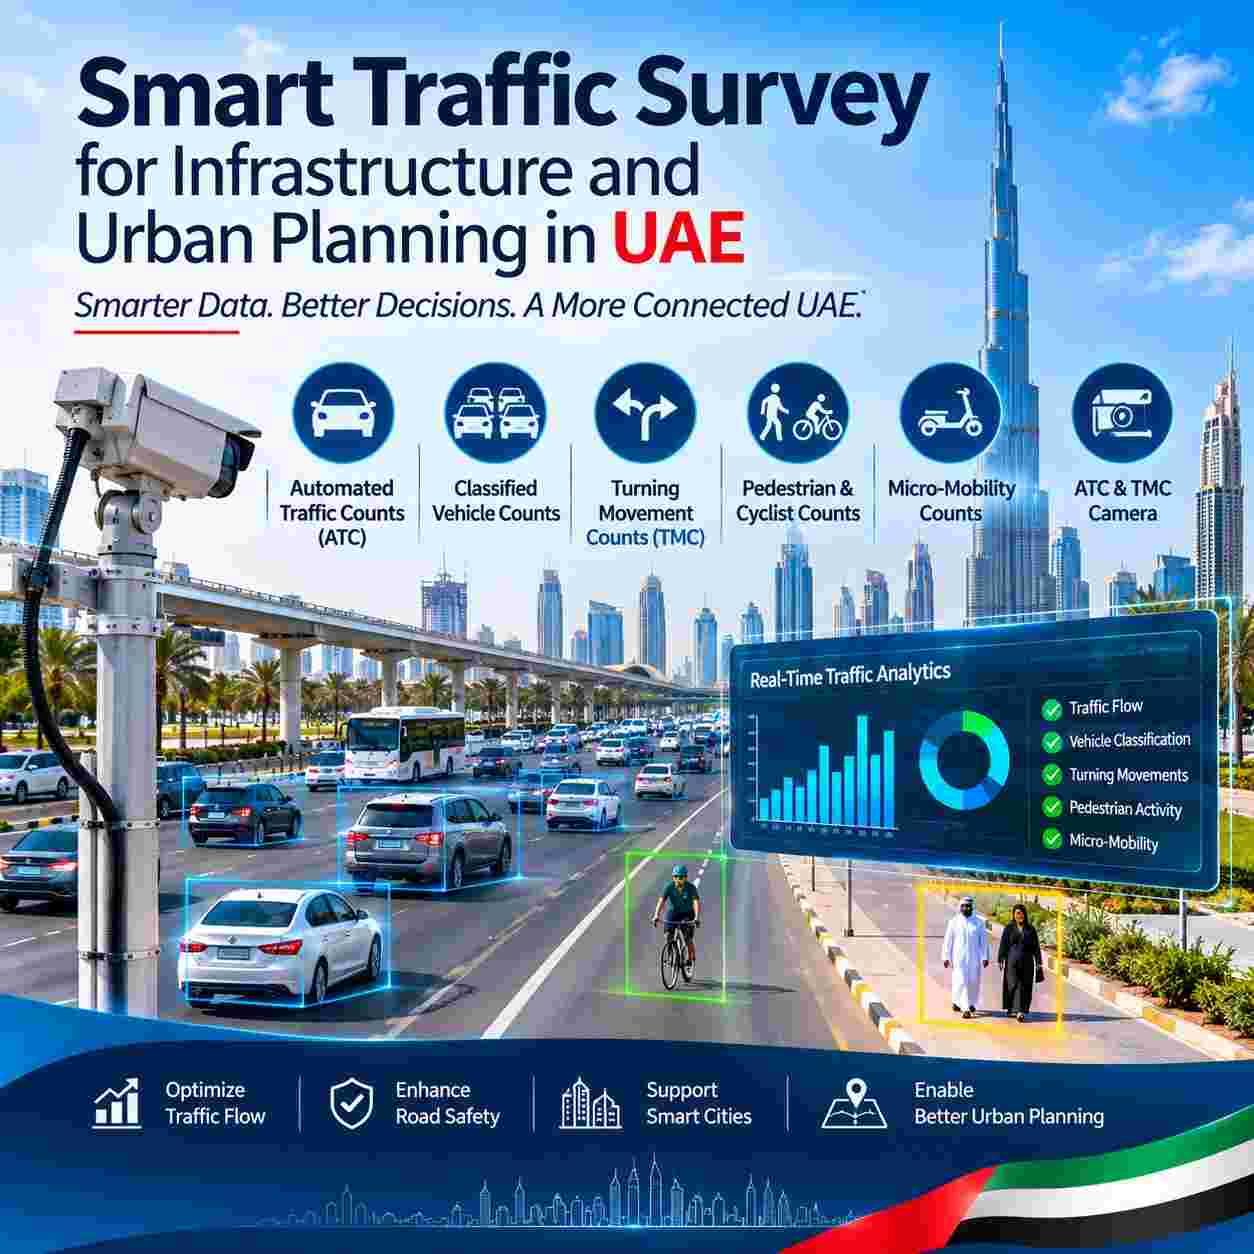
Why Evidence Comes First in UAE Planning
The United Arab Emirates is building at a pace few countries can match. Dubai 2040 Urban Master Plan, Plan Abu Dhabi 2030, new airports, ports, logistics zones, residential communities and mixed-use districts all depend on road networks that must work on the day they open and for decades afterward. Every design decision, from the number of lanes on a new arterial to the length of a turning pocket at a junction, rests on assumptions about how people and vehicles will move.
Assumptions are risky. Guessing too low leads to congestion, queues, safety problems and expensive retrofits. Guessing too high wastes land, capital and construction time. Reliable observations replace guesswork with facts, and they give owners, authorities and lenders a shared basis for decisions. That is why approval bodies such as the Roads and Transport Authority in Dubai and the Department of Municipalities and Transport and Integrated Transport Centre in Abu Dhabi expect transport studies to be supported by credible field data.
Standards help planners speak a common language. Methods follow guidance from bodies such as the Institute of Transportation Engineers and the Highway Capacity Manual, and local requirements from the Ministry of Energy and Infrastructure and emirate authorities define how studies are submitted. A survey program that respects these references saves weeks during review and reduces the chance of rework.
What Smart Traffic Survey Really Means
The word smart describes a way of working, not a single gadget. It starts with sensors that record movement accurately day and night, whether radar units, tube counters, cameras or thermal devices chosen for the road and the question. It continues with software that classifies vehicles and people automatically, followed by trained analysts who sample and verify the results so errors are caught before they reach the report.
Smart programs also treat time as a variable. Instead of a single morning visit, they record across days, weeks and seasons, so that peaks, school terms, events and weather can be understood. Dashboards allow clients to view progress, download tables and check quality without waiting for a final document, and clear metadata records exactly when, where and how each observation was made.
Matching Methods to Planning Questions
No single method answers every question. The skill lies in choosing the right combination for the decision at hand. The sections below describe the main tools in plain terms and explain what each contributes to a planning study.
Long Duration Volume Data
Automated Traffic Counts (ATC) use roadside or overhead sensors to record every vehicle passing a point, usually for seven days or more. The result is a detailed profile showing hourly, daily and weekly patterns, peak periods, directional splits and speed trends. Planners use these profiles to size roads, calibrate models, check growth assumptions and understand how a corridor behaves on ordinary days compared with holidays and special events.
Understanding the Vehicle Mix
Classified Vehicle Counts separate traffic into categories such as cars, vans, buses, rigid trucks and articulated trucks. This matter because heavy vehicles take more road space, turn more slowly and cause far more pavement wear than cars. A route that looks lightly used by volume can still need strong pavement and wide turning geometry if trucks are common, and bus counts support public transport planning.
Designing Junctions with Evidence
Turning Movement Counts (TMC) record how many vehicles go straight, turn left or turn right at each approach, normally in short intervals through the peak periods. These figures drive junction layout, lane allocation, signal phasing and queue length checks. Without them, designers cannot know whether a turning bay is long enough or whether a signal will cope with the afternoon surge from a new development.
People on Foot and on Cycles
Pedestrian & Cyclist Counts capture the people who often disappear from traditional studies. Observations at crossings, bus stops, metro stations, parks, schools and waterfront promenades show how many people walk or ride, where they cross and when they gather. This evidence supports crossing design, shade, lighting, cycle lanes and safe routes to school, and it helps cities show progress toward liveability goals.
Scooters and Shared Bikes
Micro-Mobility Counts measure electric scooters, shared bikes and similar devices that are growing quickly in dense districts and tourism areas. Observations show where these users ride, whether they use carriageways, cycle tracks or footpaths, and how they interact with pedestrians. Authorities and developers use the results to plan dedicated lanes, parking zones and speed management.
Cameras That See Both Worlds
An ATC & TMC Camera brings long duration and junction level observation together on one platform. Mounted on a pole or temporary mast, the device records video that software analyzes to produce both volume profiles and movement by direction, with sample checks by analysts for quality. Using one camera for several outputs reduces equipment on the roadside, shortens installation time and ensures that figures from different studies match each other.
From Roadside to Final Report
Behind every table is a process, and a good process is visible to the client. The steps below show how a well-run survey program moves from request to handover.
Scoping and Site Selection
Work begins with understanding the decision. Is the aim to design a junction, validate a model, support an impact assessment or monitor a corridor over time? Answers define locations, methods, duration, time periods and deliverables. Site visits check visibility, power, safe access, mounting options and any risks to staff or the public.
Permissions, Safety and Setup
Surveys on public roads require coordination with the relevant authority, landowner or contractor, and equipment must be installed in ways that protect workers and road users. Traffic management plans, signage and trained crews keep setup safe, while photographs and location records document exactly where devices were placed.
Collection, Processing and Quality Control
During collection, remote monitoring confirms that devices are running and recording. After collection, software processes the data, analysts verify samples against the raw footage or records and automated checks flag gaps, odd values and obvious errors. Corrections are documented so reviewers can follow what changed and why.
Analysis, Reporting and Handover
Final deliverables usually include tables, charts, maps, methodology notes and clean data files ready to import into models. Clear summaries highlight peak hours, key movements and unusual findings, while appendices keep the detail for specialists. A short handover meeting helps teams understand how to use the material in design and submissions.
Planning Decisions That Depend on Data
Junction and Road Design
Lane numbers, turning bays, signal timings and roundabout geometry all depend on measured demand and movement. Good data lets designers right size each element instead of copying a standard layout.
Master Planning and Network Studies
Models for districts and cities need observed volumes to calibrate and validate results. Without good observations, a model may look impressive but give unreliable forecasts for road capacity, public transport and land use scenarios.
Public Transport and Active Travel
Bus lanes, stops, metro access, walking routes and cycle networks work best when planners know where people start and end journeys. Observations at stations and along corridors show where investment will benefit the most users.
Parking and Site Access
Entrances, exits, queuing areas and parking numbers affect nearby roads. Observations of similar sites help developers predict trips and design access that avoids spilling queues onto public roads.
Construction Traffic and Impact Assessments
Large projects bring trucks, workers and deliveries. Baseline observations before work begins and monitoring during construction help contractors plan routes and show authorities that effects are under control.
Local Focus: Dubai and Abu Dhabi
Dubai: Dense, Fast and Multimodal
Traffic Surveys Dubai programs deal with dense districts, major arterials, a growing metro and tram network, waterfront promenades and heavy tourism flows. Reports commonly support submissions to the Roads and Transport Authority and Dubai Municipality, and they reflect priorities in the Dubai 2040 Urban Master Plan such as walkable communities and public transport use.
Abu Dhabi: Islands, Corridors and Growth Districts
Traffic Surveys Abu Dhabi work spans island districts, long corridors, industrial zones, Saadiyat and Yas developments and expanding communities on the mainland. Studies often align with requirements from the Department of Municipalities and Transport and the Integrated Transport Centre and support goals in Plan Abu Dhabi 2030 and the wider mobility strategy.
Projects in Sharjah, Ajman, Ras Al Khaimah and Fujairah follow the same principles, each with its own authorities, road types and approval paths. A capable supplier knows each emirate and adapts methods, permits and reports accordingly.
Data Quality and Standards
Good data is accurate, complete, consistent and documented. Accuracy comes from suitable sensors, careful installation and verification against manual samples. Completeness means few gaps in time and location. Consistency means the same definitions are used throughout, such as vehicle classes, movement codes and time intervals. Documentation records every choice so another engineer can understand and reuse the data years later.
Clients can ask suppliers to share their accuracy checks, calibration methods and quality procedures. Reports that include these details, along with clear descriptions of limitations, are more convincing to reviewers than reports that present numbers without context.
Privacy, Safety and Responsible Data Use
Cameras and sensors observe public spaces, so privacy matters. Modern programs analyze movement and counts rather than identity, blur or avoid capturing personal details, store raw footage securely and delete it after quality checks. The Federal Personal Data Protection Law, Decree Law 45 of 2021, and local rules guide what is collected and how long it is kept. Programs aligned with ISO 27001 for information security give clients extra confidence that data is handled carefully.
Worker and public safety are equally important. Teams use high visibility clothing, approved traffic management plans and safe installation methods, and they follow client and authority rules for working near live traffic. A supplier with a clear safety record is a safer partner for any project.
Designing a Survey Program That Works
Timing shapes results. Choose periods that represent normal conditions, avoiding unusual events unless they are the subject of study, and consider school terms, Ramadan patterns, summer heat and holidays that change behaviour. Seasonal variation can be large in tourism and education areas, so long term monitoring sometimes gives a truer picture than a one-week snapshot.
Coverage matters as much as timing. Place devices where they capture the movements that drive the decision, include control locations for comparison and make sure that peak periods for all modes are covered. Agree deliverables, formats and deadlines in writing so that everyone knows what will arrive and when.
Common Mistakes to Avoid
Even careful teams make avoidable errors. Frequent mistakes include surveying only one day, choosing locations for convenience rather than relevance, ignoring pedestrians and new modes, skipping quality checks, mixing definitions between studies and starting too late so that data arrives after design decisions are made. Another mistake is collecting data without a plan for how it will be used.
A final mistake is treating data as a one-time purchase. Cities change quickly, so repeating observations after opening, and again after growth, shows whether designs work as expected and where adjustments are needed.
Questions to Ask Every Supplier
A short list of questions reveals a great deal about any bidder. Ask for similar projects in the UAE and for clients who can confirm results. Ask who leads the work, how quality is checked and how privacy is protected. Request sample reports, details of equipment, calibration procedures and examples of dashboards or data files. Confirm that outputs match the formats required by the relevant authority.
Finally, ask for a clear timetable with milestones, safety arrangements and a plan for handling weather, equipment failure or access problems. Suppliers who answer these questions in writing, without hesitation, are usually the ones who deliver on their promises.
Understanding Cost and Value
Costs usually depend on the number of locations, duration, methods, reporting detail and traffic management needs. Value appears in better designs, fewer approval delays, lower risk of costly redesign and greater confidence among authorities and lenders. Finance teams can compare the modest cost of good data with the much larger cost of getting a major road or junction wrong. Starting early and combining several studies in one program can also reduce mobilization costs.
Trends to Watch Over the Next Few Years
Observation technology continues to improve. Artificial intelligence classifies more road users with higher accuracy, edge devices process video at the roadside to reduce data transfer, and dashboards allow live monitoring of key corridors. Combining survey data with connected vehicle information, public transport records and sensors in smart streets gives planners a fuller picture than any one source can provide.
Policy trends matter too. Net Zero 2050, active travel programs and growth in shared mobility all increase the need for evidence about how people choose to move. Programs that measure these shifts regularly will help cities adapt quickly and show progress toward national goals.
Why Work with Top Precisions
A strong method needs a strong delivery partner. Top Precisions plans, collects and reports traffic data collection services for infrastructure and urban projects across the Emirates, and our team aligns each program with authority requirements, recognized guidance and clear quality procedures. For Traffic Surveys UAE clients, that means a named project lead, documented methodology, safe and tidy site work, verified data and reports that reviewers can follow.
Our approach is evidence first. We agree objectives and deliverables before mobilization, check quality at every stage and share results in formats that engineers, planners and authorities can use immediately. Readers who want details of methods, equipment and sample outputs can review the full-service page or explore smart road and mobility studies before requesting a quotation.
A Six Step Roadmap
- Define the decision the data must support and list the locations that matter.
- Choose methods, durations and time periods that match the question.
- Confirm permissions, safety arrangements and privacy measures.
- Collect data with live monitoring and documented checks.
- Process, verify and analyze results, then share clear tables and charts.
- Repeat observations after opening or growth to confirm that designs perform.
Following a clear roadmap keeps budgets focused, protects project timelines and makes supplier proposals easy to compare.
Conclusion
Traffic Surveys turn assumptions into evidence for every road, junction and public space the UAE builds. Automated Traffic Counts (ATC) and Classified Vehicle Counts reveal volume and vehicle mix, while Turning Movement Counts (TMC) guide junction design. Pedestrian & Cyclist Counts and Micro-Mobility Counts bring people and new modes into the picture, supported by an ATC & TMC Camera that captures reliable data. From Traffic Surveys UAE programs to Traffic Surveys Dubai and Traffic Surveys Abu Dhabi projects, local knowledge and careful planning protect every investment.
FAQs
How long should Automated Traffic Counts (ATC) run to capture normal conditions?
Most studies record for at least seven consecutive days so that weekdays and weekends are both covered. Longer periods help in areas affected by school terms, tourism or events, and holidays should be avoided unless they are the subject of the study.
Why do Classified Vehicle Counts matter for pavement and junction design?
Heavy vehicles cause much more pavement wear than cars, need wider turning space and slow traffic flow. Knowing the mix lets engineers choose suitable pavement strength, lane widths, turning geometry and signal timings.
When are Turning Movement Counts (TMC) needed?
They are needed whenever a junction is designed, upgraded or assessed, including signal timing reviews and development impact studies. Observations usually cover morning and evening peaks in fifteen-minute intervals for every movement on every approach.
What times of day suit Pedestrian & Cyclist Counts?
Cover commuting peaks, lunch periods, evenings and weekends near leisure and retail areas, and add school start and finish times where relevant. Record weather and season, because summer heat and cooler winter evenings change how many people walk or ride.
How are Micro-Mobility Counts different from ordinary bicycle observations?
They separate electric scooters, shared bikes and similar devices from traditional cycles and note where each travel, whether on carriageway, cycle track or footpath. Rules differ between emirates, so the survey plan should follow local regulations and parking arrangements.

 English
 Arabic
 French
 Spanish
 Portuguese
 Deutsch
 Dutch
 Italiano
 Russian
 Romaian
 Portuguese (Brazil)
 Greek